Read below
or watch this video guide
This work is both a historical research project and a pedagogical tool that can be used by researchers to form new connections within the material and create original work. The exhibit was designed to provide researchers with multiple "ways in" to this material, depending on their learning preferences.
Researchers can understand material geospatially through the Map, view chronologically and by subject tag through Browse, read every document visually or aurally through text to speech software on the Data page. Researchers can engage with oral history recordings as text or original audio recordings through Transcripts or visually, through the Subjects function.
Researchers can understand a large amount of text information very quickly through moving images in Text Mining, and gauge linguistic change over time. Finally, researchers can engage with the material interactively through the Network Visualization, where the entire collection is represented in a single frame and communities and associated industries can be highlighted and filtered to create future research.
The following gifs will show you the different ways that you can engage with this resource:
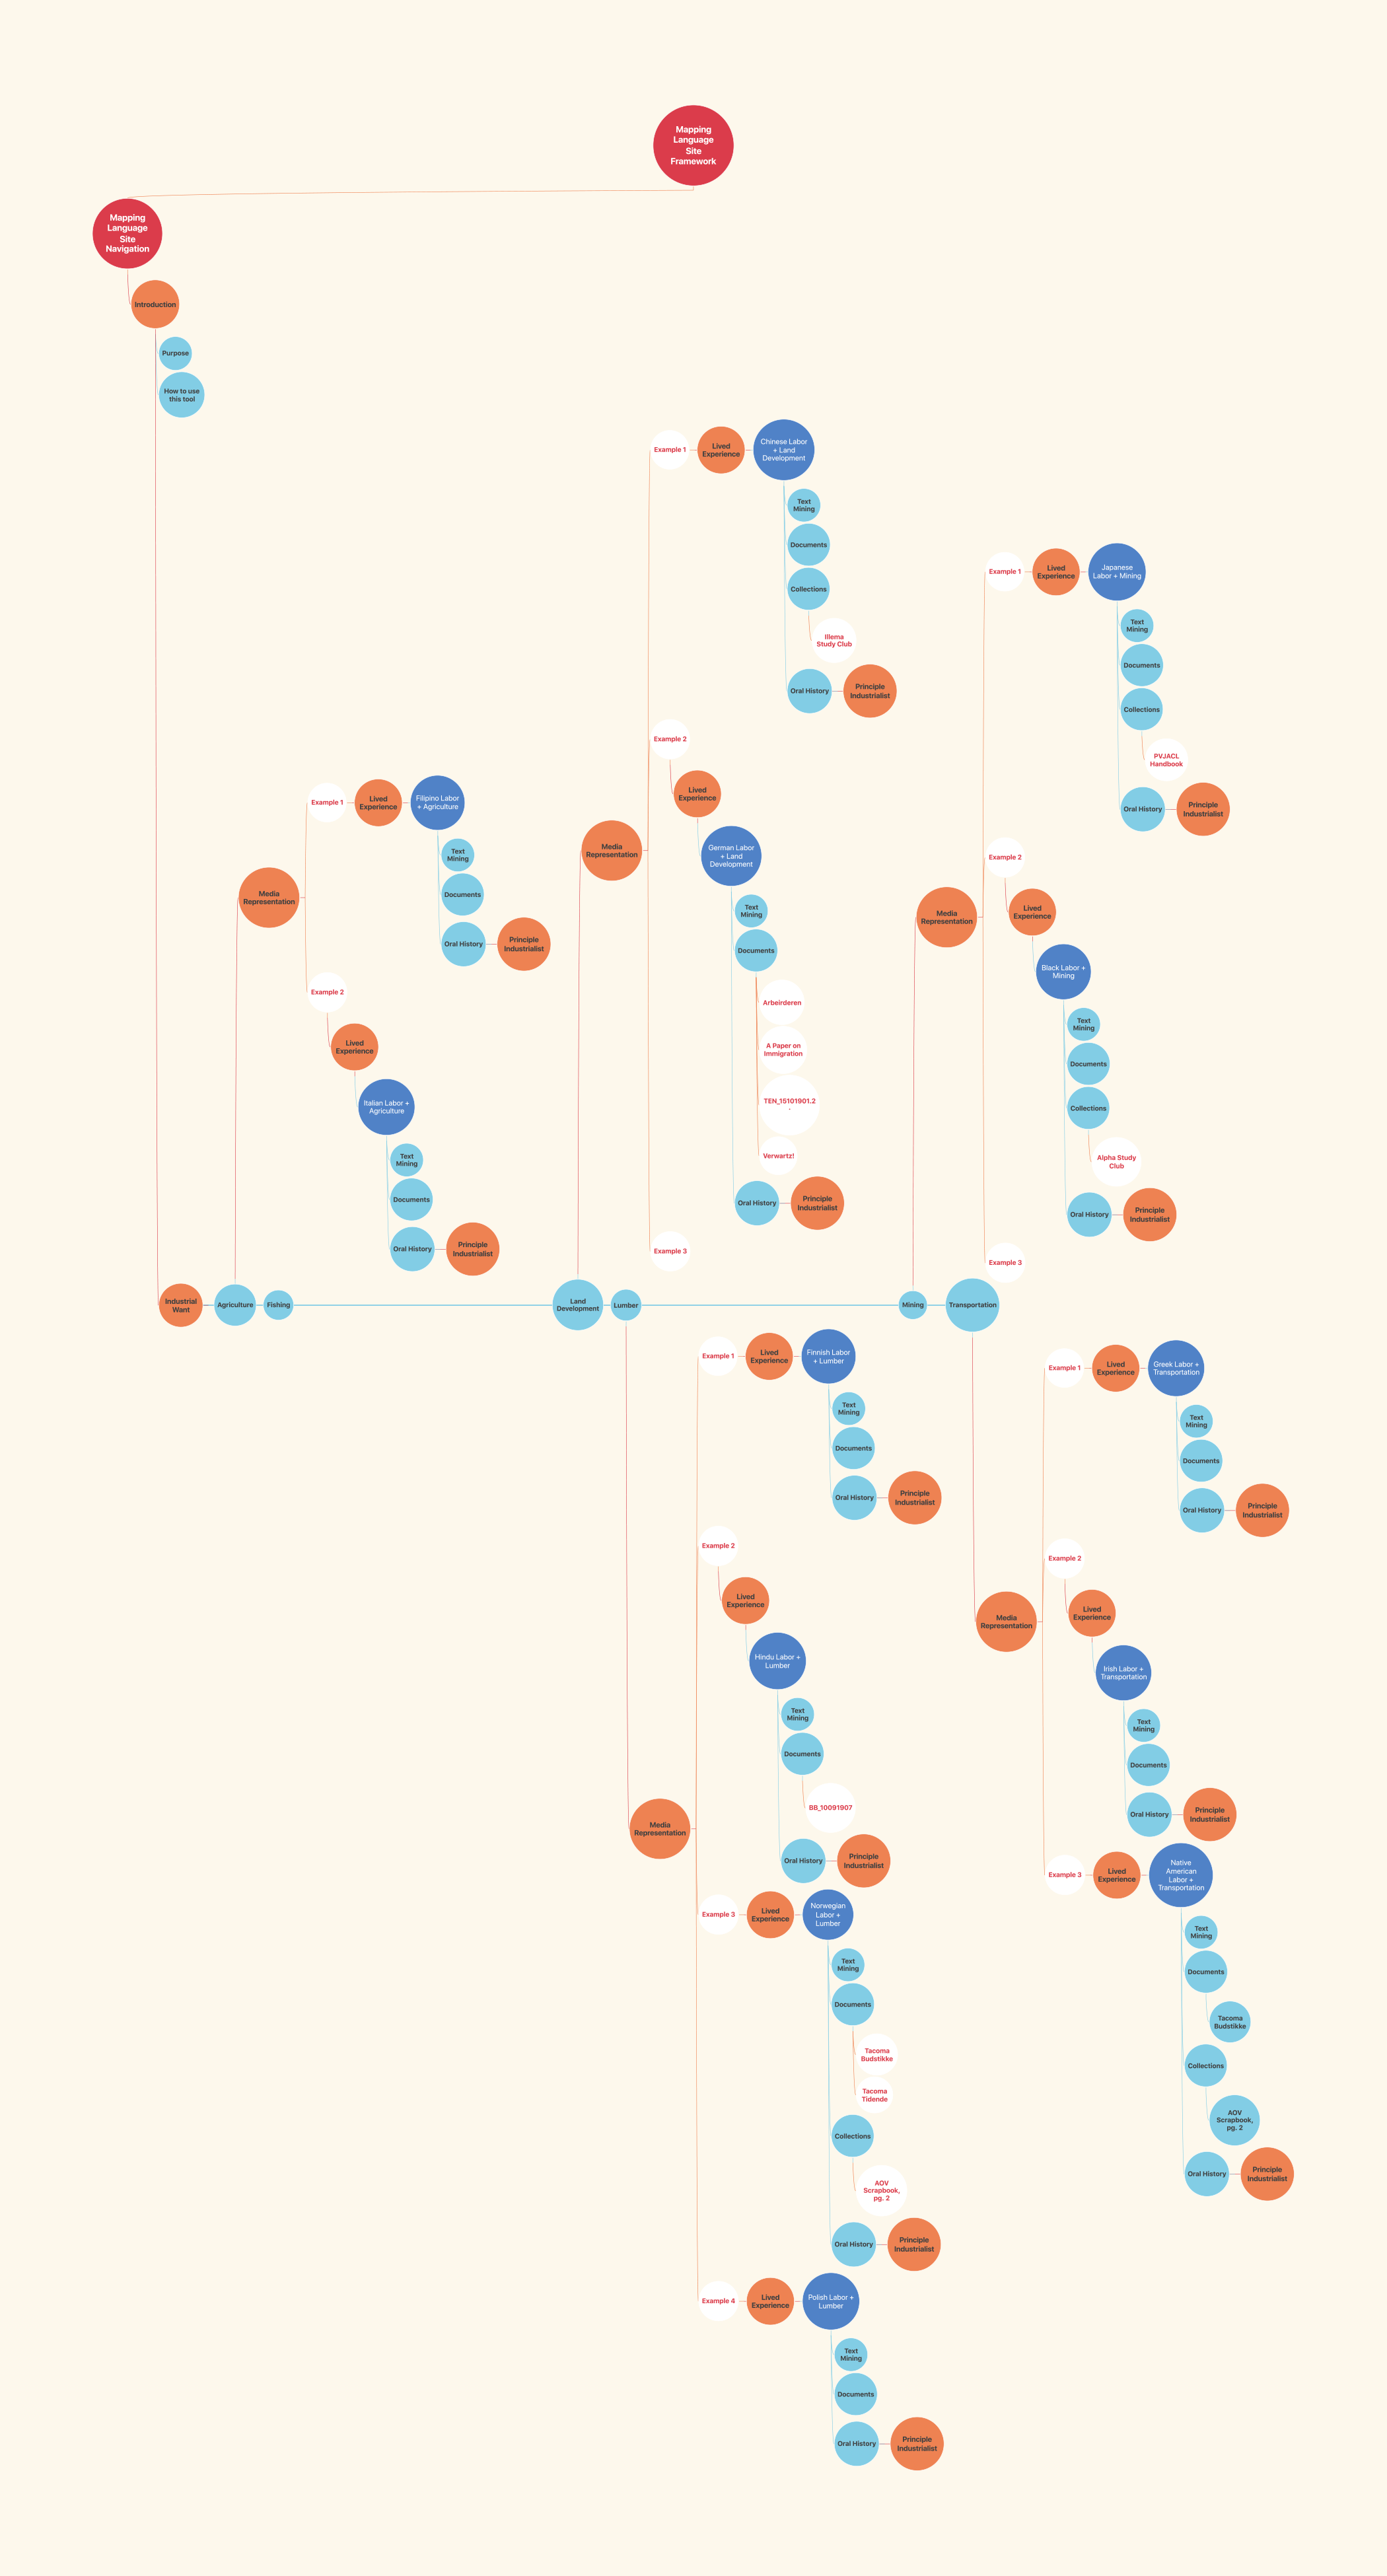
· Early draft of site framework
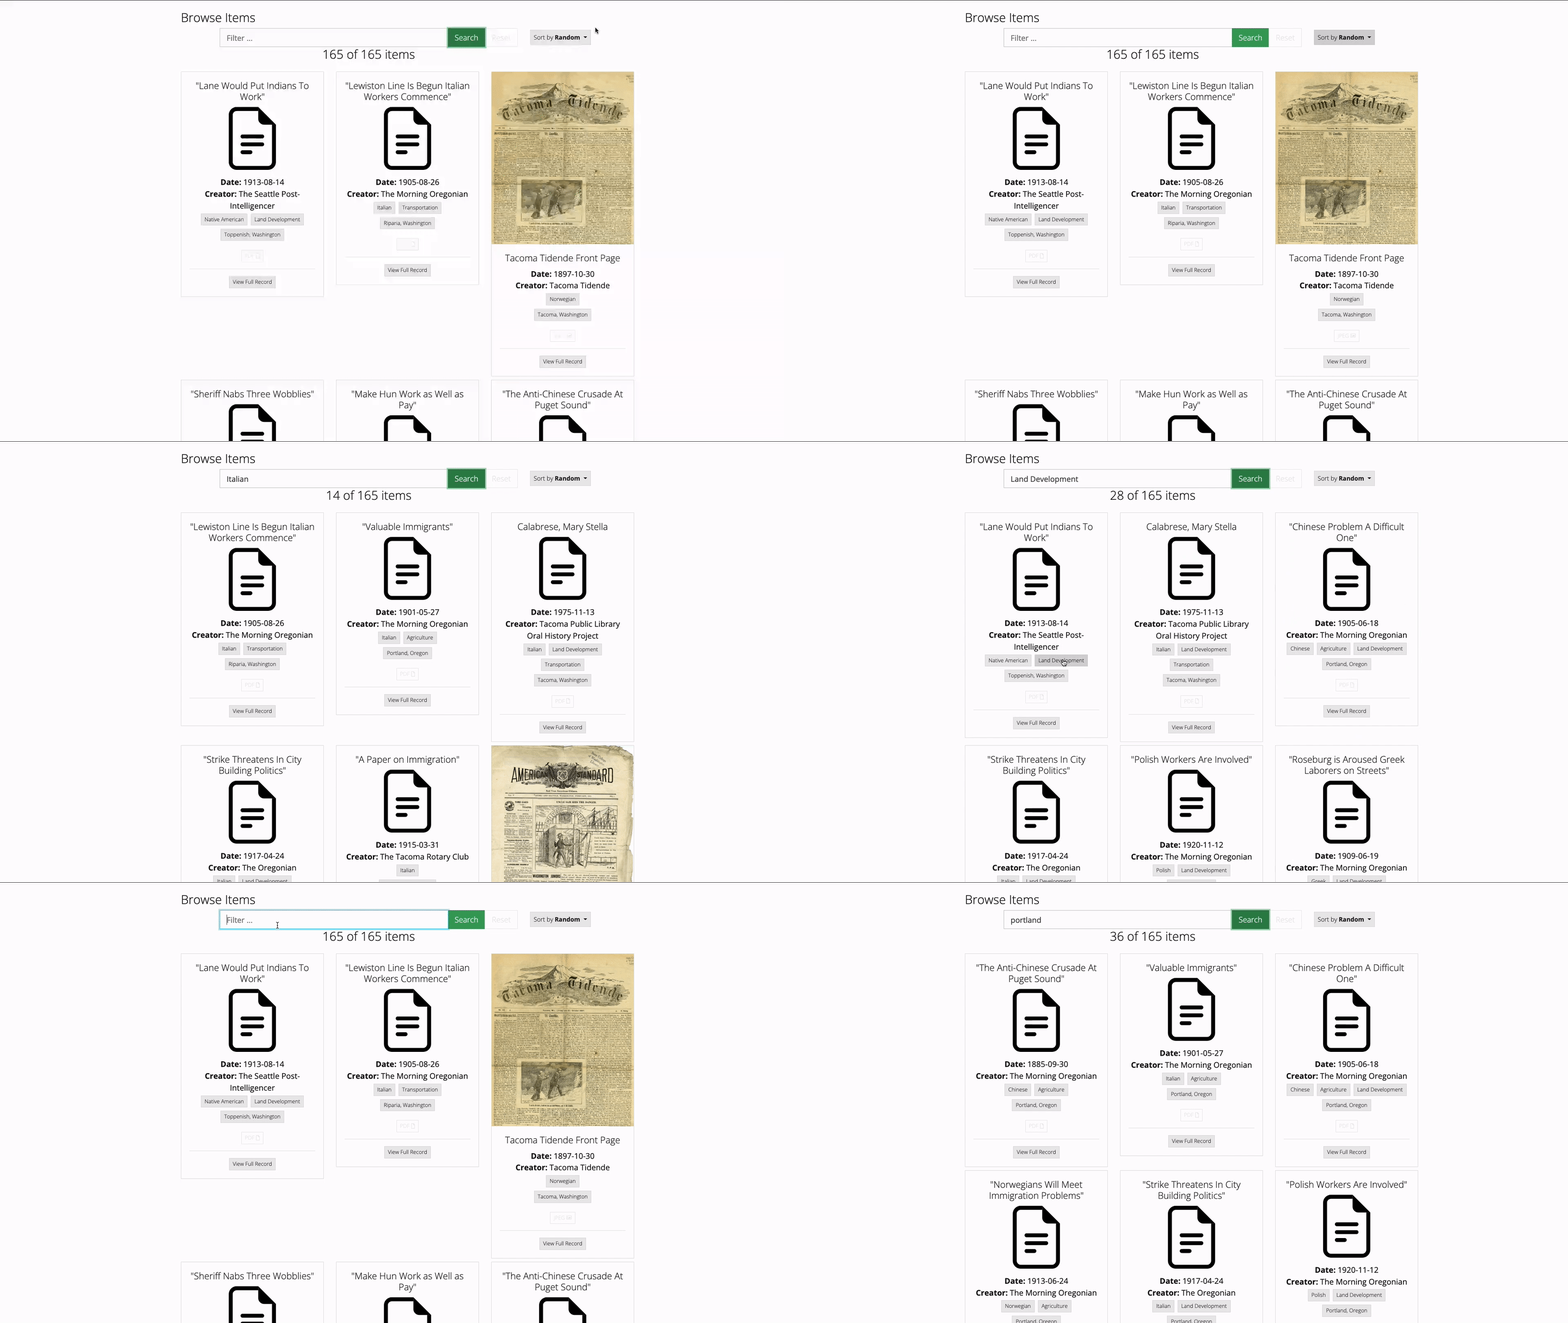
you can sort items chronologically or by title. You can engage with the community, industry and location tags to filter items and search for specific terms. Note that any records that are titled simply by name indicate oral history recordings, which can be engaged with in the Transcripts and Subjects sections.
you can understand the geospatial relationship between documents, quickly view the essential metadata and visit full records of the documents.
you can download the entire data set in Excel or CSV to pursue your own research. Exploring the individual record pages, you can view the full metadata for the item. PDF items can be read visually or using text to speech directly from the item window or expanded and read using the "download PDF" button. Image files can be expanded and zoomed in on with a light box functionality.

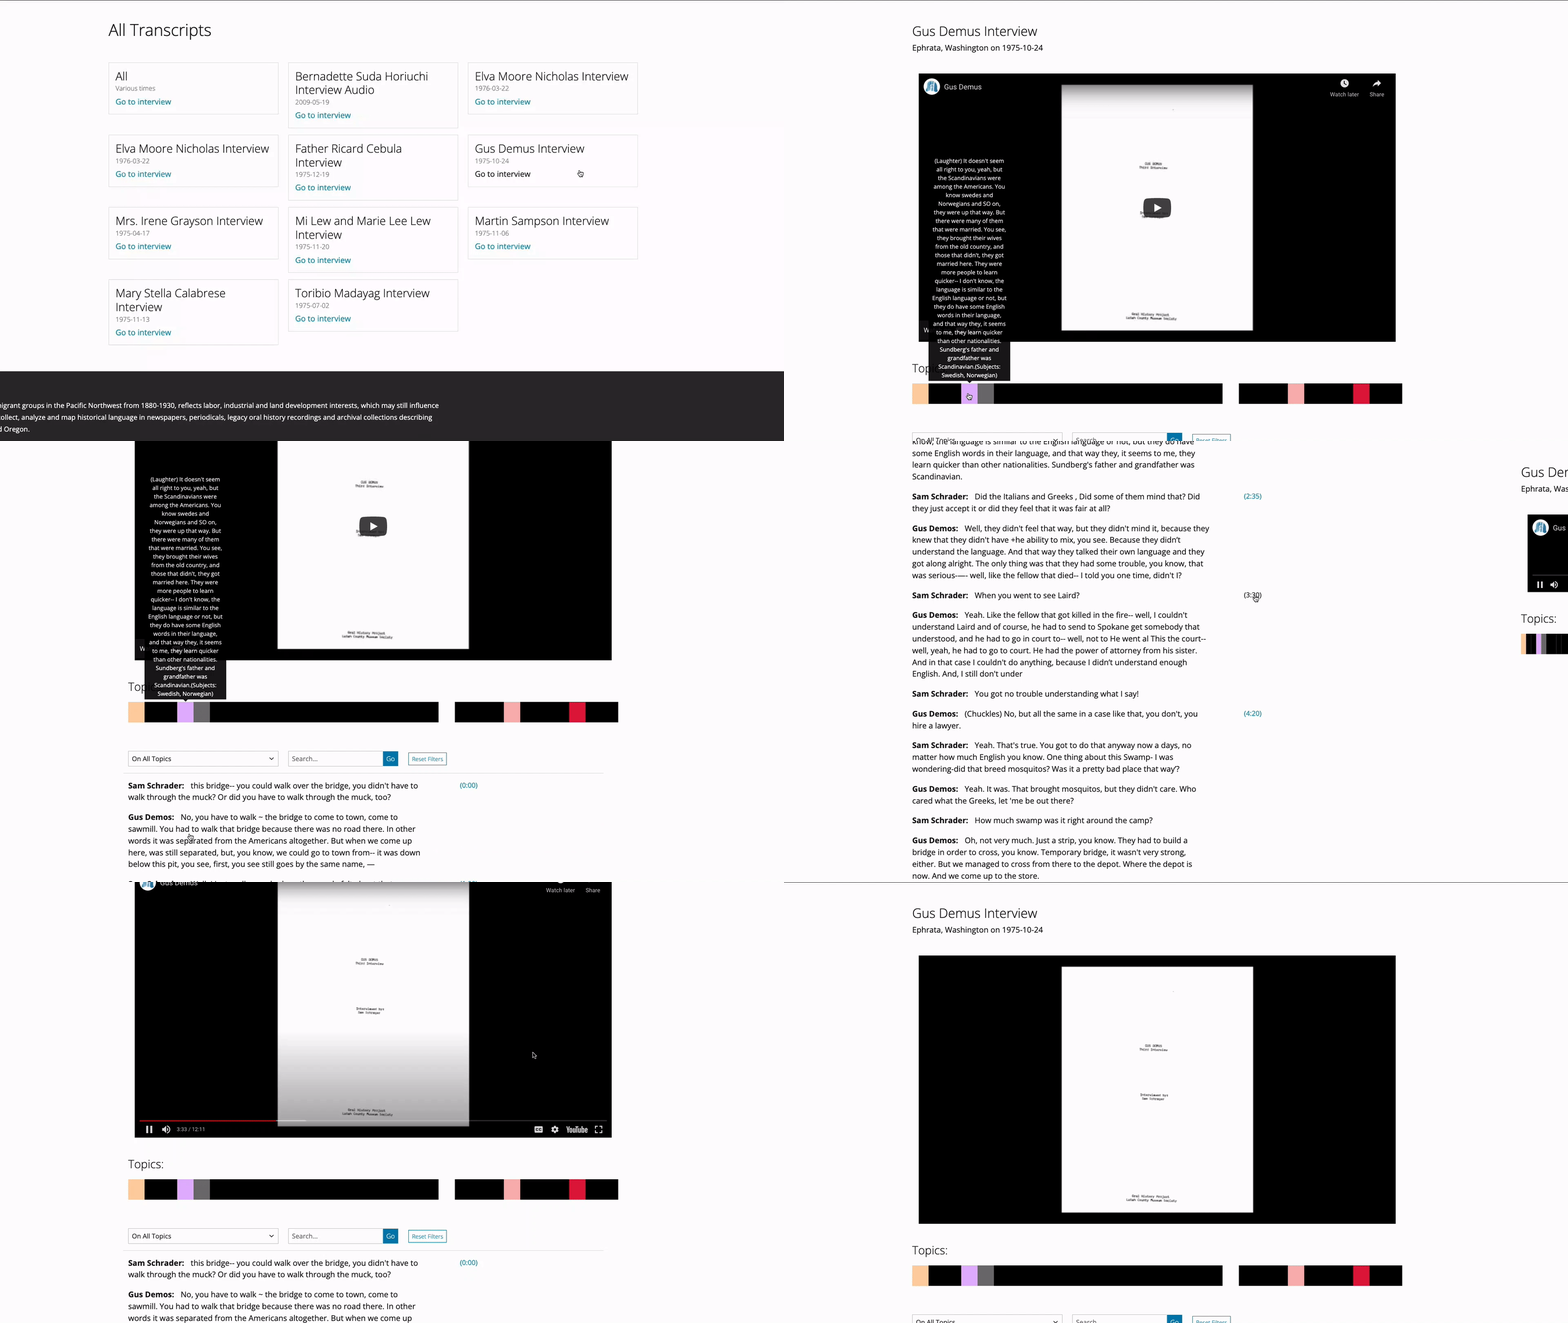
of Oral History Recordings, you can scan text of a recording and jump directly to points of interest and engage audio recordings via timestamp.
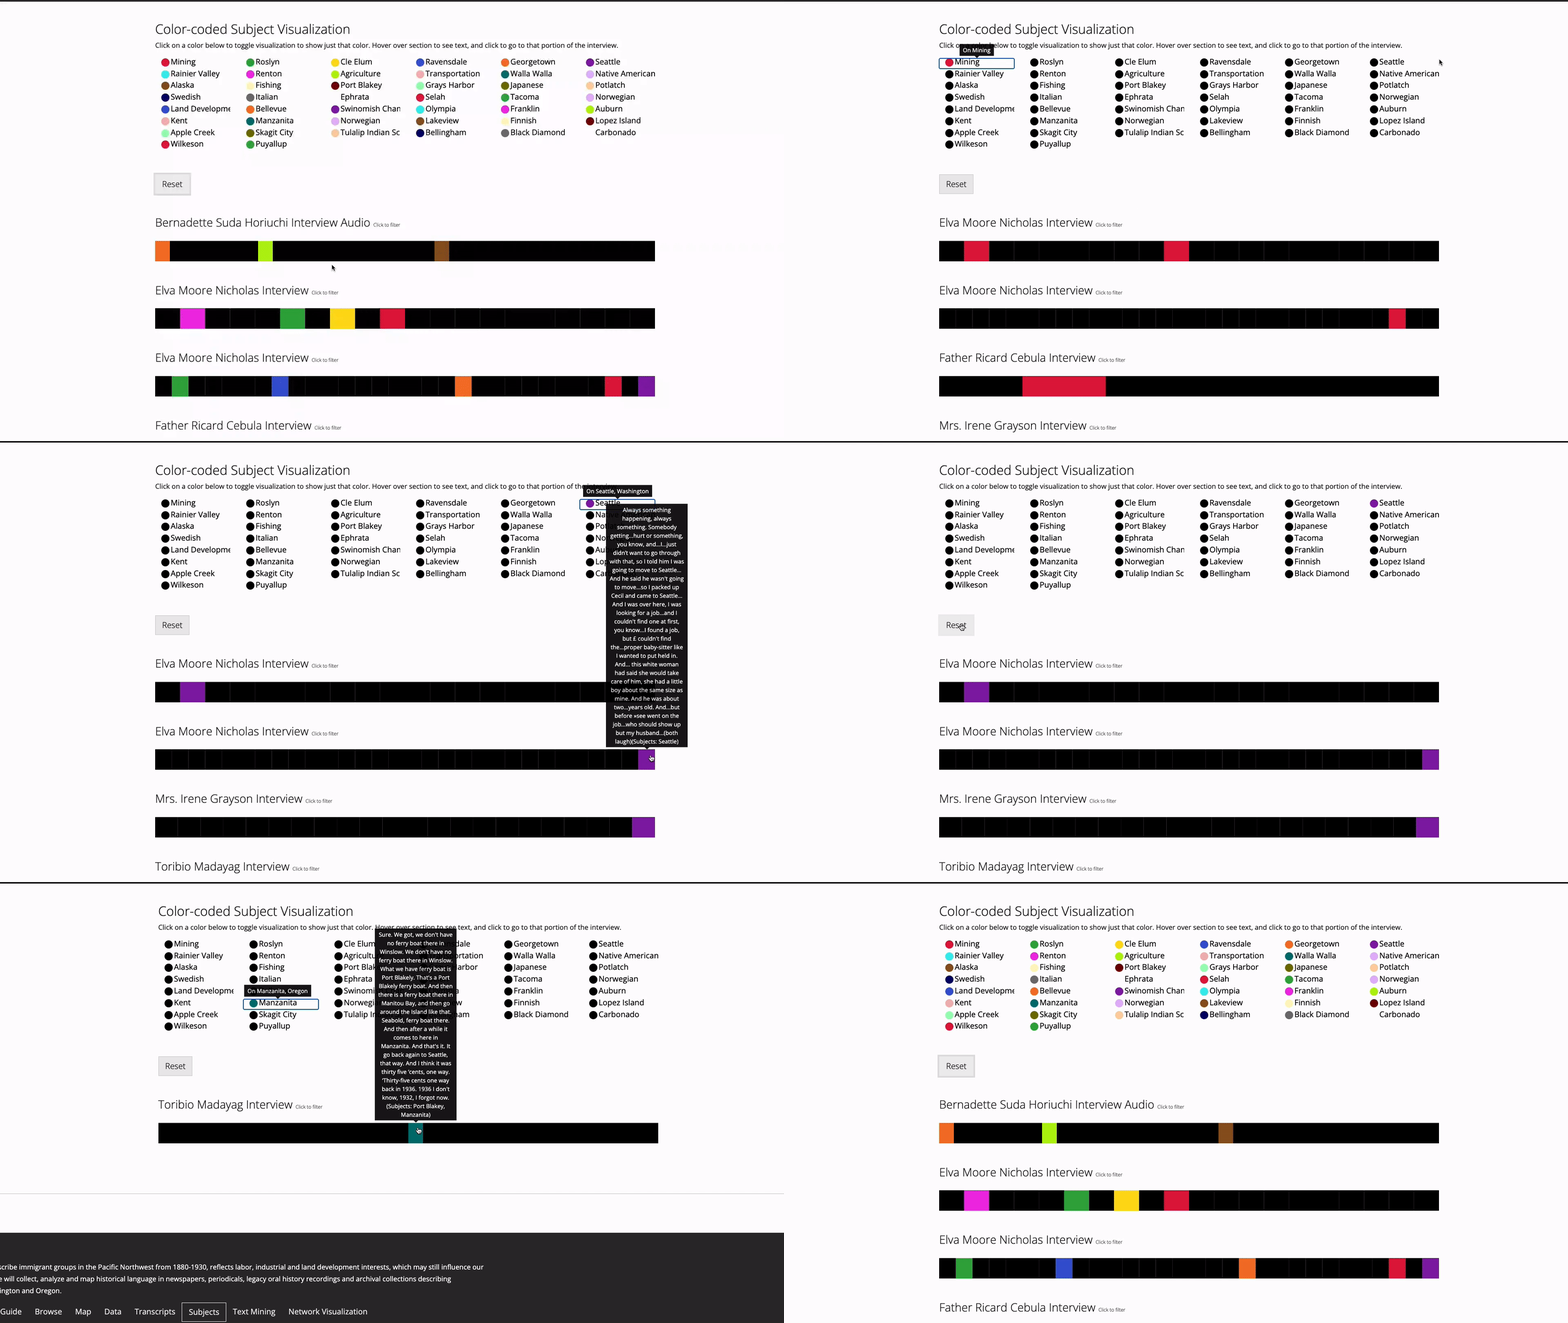
industries and communities can be identified across multiple recordings. Note that you need to push Reset in order to clear subjects for new searches.
you can engage with how specific community groups were represented in media and contrast that linguistic change over time. The visualization that you see are the number of times particular words are repeated within the corpus, demonstrated by the size of each word's bubble. Hover over the bubble for the exact number and drag the bubbles around if you have trouble reading anything depending on how the visualization loads.
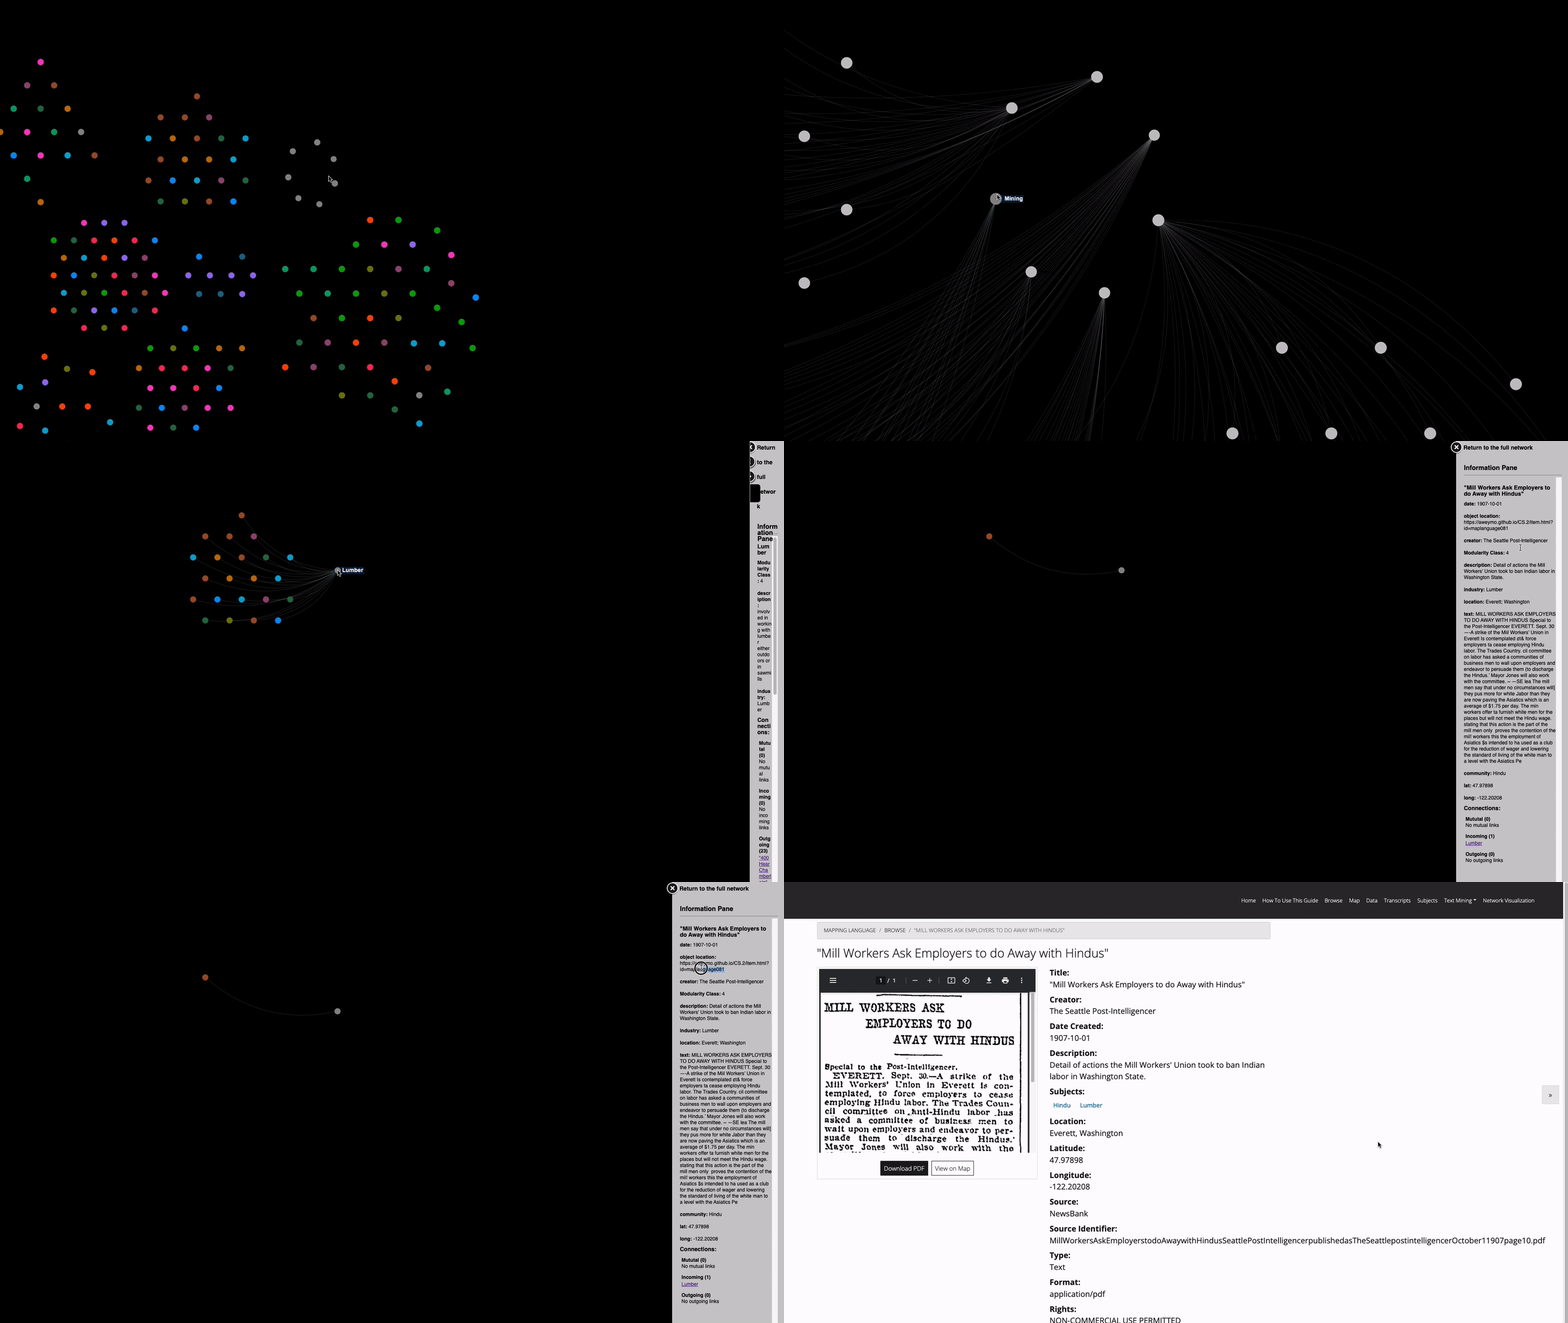
you can assess relationships between industries, community groups and locations in a single window. Full text of materials are included along with URLs for the item's full record, although you will need to copy paste into your browser as hyperlinking is unavailable for this tool. You may also search for titles within the attribute pane.
